Archivos de diario de enero 2020

01 de enero de 2020

December 2019 Photo-observation of the Month

Congratulations to Craig Hunt for winning the December 2019 Vermont Atlas of Life iNaturalist photo-observation of the month. The image of a Sharp-shinned Hawk taking a Blue Jay in the snow in Townsend, Vermont garnered the most votes.

With over 1,800 photo-observations submitted by 160 observers this month, it was very competitive. Click on the image to see and explore all of the amazing photo-observations.

The autumn river of raptors migrating southward becomes dominated by Accipiters like Sharp-shinned Hawks in October. Although not all individuals leave, many do. More than 11,000 Sharp-shinned Hawks were seen on one October day at Cape May Point, New Jersey as they pushed southward. Most overwinter somewhere in North America; however, some travel as far south as Central America, migrating thousands of miles between their breeding and wintering grounds. They are powered by a mix of flap-gliding flight and soaring on mountain updrafts and rising plumes of hot air. Recently, more Sharpies have been overwintering farther north. No one knows exactly why, but the popularity of backyard bird feeding may provide some Sharp-shinned Hawks the food they need to survive northern winters.

Sharp-shinned Hawk populations currently appear stable, after dramatic declines during the DDT pesticide era (mid-1940s to 1972). Recently, work by VCE has shown that individuals nesting in Vermont’s Green Mountains and a rare subspecies in the mountains of Hispaniola, have high levels of mercury in their blood. Learn more from VCE’s Research Notes about this finding.

Visit the Vermont Atlas of Life on iNaturalist where you can vote for the winner this month by clicking the ‘fav’ star on your favorite photo-observation. Make sure you get outdoors and record the biodiversity around you, then submit your discoveries and you could be a winner!

Publicado el enero 1, 2020 03:49 TARDE por kpmcfarland kpmcfarland | 0 comentarios | Deja un comentario

03 de enero de 2020

Naturalists Help the Vermont Atlas of Life Build Biodiversity Big Data in 2019

From the first observation of 2019, a Barred Owl sitting on a deck submitted by naturalist extraordinaire Roy Pilcher, to a Christmas Fern laying on snow shared by Bondaley on the last day of the year, naturalists added over 100,000 biodiversity records to our rapidly growing database of life in Vermont. Thank you!

And amazing observations kept coming all year long. We had  3,896 naturalists contribute  more than 104,140 observations representing over 3,300 species verified. Over 2,800 naturalist helped to identify and verify data. And we joined the more than 615,000 iNaturalists worldwide that submitted over 13 million observations in 2019!

Check out the 2019 year in review statistics dashboard, and if you’re an iNaturalist you can see your year in review too. Share it proudly on social media and tag it with #vtatlasoflife!

The Vermont Atlas of Life on iNaturalist has grown leaps and bounds since 2013. We now have over 375,000 biodiversity observations in the database. Note the peaks and valleys of data sharing match the seasons each year.

Publicado el enero 3, 2020 01:54 TARDE por kpmcfarland kpmcfarland | 0 comentarios | Deja un comentario

07 de enero de 2020

Tech Tip Tuesday: Adding Historic Photographs

Happy New Year! I hope that your past two weeks were filled with happiness and relaxation. Or I hope that they were at least filled with good food and plenty of places to hide when you’re tired of talking to people. Realistically, it might have been two weeks of both.

Welcome back to Tech Tip Tuesday everyone! If you’re new here (maybe your New Year’s resolution to get more involved with iNaturalist led you here) this is a weekly series where I share a tidbit of iNaturalist wisdom to help you expand your repertoire of naturalist know-how. Since the New Year is about new beginnings, I figure it’s time to add an extra element to TTT. I will continue brainstorming weekly topics with the Vermont Atlas of Life team, however I want to encourage you all to be a part of this process. If you have a burning iNaturalist related question that you would love to see as a TTT topic, I invite you to write to me either through iNaturalist or my VCE email address. Obviously I may not be able to address every question the week that they’re submitted, but rest assured that your questions will not go unanswered!

This Week on Tech Tip Tuesday

iNaturalist is a great tool for identifying the plants, animals, and fungi photographed as you go about your outdoor adventures, but what about all of the wildlife photos you took before iNaturalist existed? Good news – you can totally add those too! That’s right, that black bear you snapped a photo of during your camping trip in 1995 can take up residence on your iNaturalist account. Along with helping you increase your number of observations, these photos can provide scientists with valuable insight into conditions and species presence at certain points in time. In some cases, historic photographs and documents serve as the only records that provide clues to past environmental conditions in a particular area. By examining these records, scientists can see how an animal, plant, or fungi’s phenology (timing of biological events, such as migration or flowering) has changed over time. This in turn helps scientists better understand how species react to climate change and other environmental disturbances in the past, and predict how they may continue to respond in the future.

Before you start posting all of your nature pictures from the past few decades, I’m going to lay out some guidelines so that they can serve as meaningful data points.

1. Make sure the date is correct. When uploading the photos, double check that the date assigned to the photo is the date you took it, not the date that you’re uploading it. You can change the date when you’re adding an observation by clicking in the box that says “date” (this is above the box that says “location”). If you don’t know the exact date, then either leave the “date” box blank or choose a day in the correct month and add a comment saying that the date is not exact. If you choose the second option, make sure to note whether the year and month are correct.

2. Make sure that the location is correct. This can be tricky. If you didn’t write down where you took the photo and it doesn’t have GPS coordinates, you may not know the exact location. Luckily, there is a way to indicate a level of uncertainty when setting an observation’s location.

To change the location, first click on the box that says “location” when adding the observation. This will take you to a page with a map. If using iNaturalist on your computer, you will have the option to type in the location and search for it (sorry mobile phone users). For either mobile phone or computer users, you can zoom in on the area of the map where you were. It’s ok if you only know what town, state, or region you were in. You will notice that your map either has a big red circle (computer users) or a black target (mobile phone users). The size of the area that these circles cover refers to the area in which you made your observation. If you know that you saw your black bear in the parking lot of Lake Dunmore State Park, then you shrink the circle so that it only encompasses the parking lot. On the other hand, if you only know that you saw the bear somewhere in Salisbury, then you make the circle large enough to cover all of Salisbury. The center of the circle is placed on the area where the bear was most likely seen and the circle size communicates to those using the data what the possible range of true observation locations were. Once you have your location circle set, click “Update Observations” (computer users) or the back arrow (mobile phone users).

A final note: please do not guess at the exact location. It’s better to have a large circle encompassing half of Vermont than to have a small circle around the wrong location.

3. Edit pictures as needed. Maybe your photo was shot when you were just learning and the image is blurry or grainy. Maybe you were interested in a different scene at the time and your observed species is on the very edge of the image. If you can, edit photos before uploading them so that the subject is as clear and obvious as possible. But even a crummy image can be an important piece of evidence, so don’t worry if it isn’t the best image.

4. Add observations for all species. It’s ok to add the same photo multiple times if there is more than one species present, as long as the date and location information is kept consistent. For information on how to do this, check out TTT #2.

TTT Task of the Week

As we find ourselves increasingly entangled in winter’s icy grip, it’s tempting to stay indoors and observe nature from a frosted window. If this sounds like your cup of tea, then I encourage you to take this time to stroll down memory lane and revisit old nature photos. Post any that you come across, even if it’s a species that seems super common. Species that are common now may not remain that way, therefore documentation is still important. Just remember to set the date and location properly. If you have any questions, don’t hesitate to contact me!

Thank you for helping us map Vermont’s biodiversity and happy observing!

Publicado el enero 7, 2020 06:33 TARDE por emilyanderson2 emilyanderson2 | 0 comentarios | Deja un comentario

14 de enero de 2020

Tech Tip Tuesday: Identification Resources

Happy spring everyone! Oh wait…

Just kidding, but you could have fooled me. Sunday was almost t-shirt weather. And I’m not the only one who felt spring in the air. This weekend, I noticed a flurry of insect activity both inside my house and beyond. Many insects who usually hunker down in the cracks of my house decided to take advantage of the warm weather to forage and stretch their wings.

While some of us may enjoy a break from winter’s icy grip, unusual warm spells can cause problems for wildlife. In some cases, unusually warm weather can cause species that rely on temperature cues to emerge too soon, leaving them vulnerable to starvation and freezing if temperatures plummet. In other instances, phenological mismatch can occur when temperature-dependent food sources emerge before daylight-dependent species become active.

As weather and temperature patterns become increasingly erratic, the consequences to different species will become more pronounced. However, tools like iNaturalist are a real game changer. By tapping into iNaturalist’s vast network of citizen scientists, professionals tackling these issues can monitor how species respond and develop conservation plans to support species as their surrounding environment changes.

This Week on Tech Tip Tuesday

Besides monitoring species, iNaturalist is also well known for its role in helping people learn how to identify the life around them. However, we can all use a little outside help from time to time. Maybe there’s a particular species of fern that has the automatic identification stumped. Or maybe you want to confirm that someone’s suggested identification is correct. Regardless of your needs, there are plenty of resources to help you identify the plants, animals, and fungi you encounter in your travels.

Below is a sample of the Vermont Atlas of Life team’s go-to resources.

Birds:
Sibley Guides and Apps
Merlin Bird ID
U.S. Fish & Wildlife Service – The Feather Atlas

Botany:
GoBotany
The Sibley Guide to Trees

Entomology:
BugGuide
Moth Photographers Group
Flower Fly genera
Lady Beetles
Bee genera
Wasps
Butterflies

Introduced Species:
USGS Nonindigenous Invasive Species
iMap Invasives

General:
Discover Life

TTT Task of the Week

Take some time this week to explore any of the unfamiliar resources listed above. See if you can find some new favorites. I also invite you to comment down below or email me directly with your own favorite resources. Let’s see if we can get a big list going that people can turn to when they need help!

Thank you for helping us map Vermont’s biodiversity and happy observing!

Publicado el enero 14, 2020 08:14 TARDE por emilyanderson2 emilyanderson2 | 13 comentarios | Deja un comentario

21 de enero de 2020

Tech Tip Tuesday: Using Identify

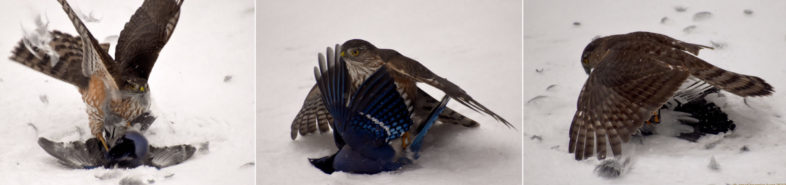
And just like that, we’re back to the usual winter programming! I’m very excited for the snow, however I could do without the sub-freezing temperatures. On the mornings where the thermostat in my car reads -5oF on my drive in, I often think about all of the wildlife (and plants) that must cope without the comforts of heated seats and woodstoves. Of course, they have countless physical and behavioral adaptations that allow them to survive. Every morning the sun rises on a new mosaic of tracks crisscrossing my backyard, letting me know that the local deer, squirrels, and four-legged predators continue to thrive despite the cold.

This Week on Tech Tip Tuesday

If this cold snap has you in hibernation mode, then this tech tip will be right up your alley. This week we’re talking about the identify tool. Now, I know that many of you have probably been putting your substantial naturalist skills to good use from the beginning of your iNaturalist adventure – after all, helping other users identify their cool finds is half the fun! However, not everyone is familiar with the time-saving wonders of the Identify tool.

How is it different than the way many of us approach identifying observations? Instead of going to “Explore”, searching for observations that “need IDs”, and clicking in and out of observations, using “Identify” allows you to use simple strokes to agree, add comments, and flip to the next observation. This means that you get to avoid the headaches caused by hitting “back” to get off a page, only to find that you’ve lost your place.

To get to the Identify tool, click on “Identify” along the top menu bar. Once you get to the page, enter the species and/or place you’re interested in identifying observations for. One neat aspect of Identify is the number of filtering options that exist. To explore these, click “Filters” to the right of “Go” next to the search bars. Once “Filters” is open, click on “More Filters” in the bottom left-hand corner to see the full range of options. Here are a few that you may find most interesting to play with:

1. Observations identified as unknown. To filter for observations marked as “Unknown”, go to the “Categories” section and click on the last option – a leaf outlined by a dotted line with a question mark in the middle. By isolating the “Unknown” observations, you can easily go through and add broad identifications like “plant” or “animal”. In doing so, you will help other identifiers looking for plants or animals find that observation more easily. Without even one of those simple identifications, observations can sometimes get lost.

2. Sort randomly. If you go to the “Sort by” section, you will notice that the last option allows you to sort your search results into a random order. This is great for instances where you may not want an order to your observations for one reason or another.

3. Help add annotations. You can use the “Without Annotation” section to find observations missing annotations. As explained in TTT #1, annotations are important to include because they provide extra information for people who may be interested in using observations to look for patterns.

4. Assist newer users. Everyone needs a little extra help when they start out, both with identifying and understanding what should and should not be posted. By going to the section titled “Account Creation”, you can filter your search results by when a user’s account was created, allowing you to focus on observations created by folks who are new to iNaturalist.

Once you have the settings adjusted to your liking, click “Update Search”. To begin, click on the first observation that you want to identify. There are several ways to edit an identification. The most straightforward way to add a new identification is by clicking “Add ID” at the bottom of the page. If you agree with a provided identification, click “Agree” next to that person’s suggestion. You can also click “Comment” on the bottom of the page to add a new comment. If you look below the observation’s photo, you will notice boxes for marking “Captive/Cultivated” and “Reviewed”. If either of these apply, please select them. Remember, being a good identifier is about evaluating the whole observation, not just correcting its species name.

If you’re looking for a speedy way to edit an observation, then it’s time to check out the keyboard shortcuts. You can find these by clicking on the keyboard icon under the observation’s photo (bottom left-hand corner). Once you click it, a menu will pop up showing you all the different shortcuts available. For example, to add a new identification you can hit “i” and a new identification box will appear. Or, if you want to agree with the most recent identification, you can click “a”. Take a moment to browse through the options and try some out (when appropriate).

Now that you’re familiar with using shortcuts to edit identifications, turn your attention to the tabs across the top of the observation’s window and notice the four tabs (currently on “Info”). Next to that, you will notice a tab called “Suggestions”. This shows you the suggested identifications for this observation.
The next tab will show you the observation’s annotations. Remember earlier (in point number 3 above) when I mentioned how you can filter by observations without annotations? By using this tab, you can add annotations to observations that need them or agree/disagree with current annotations. You can do this by hand or use keyboard shortcuts to add new information. Click on the keyboard icon again and you will notice that the list has expanded to include new shortcuts. For example, when on the Annotation tab, you can add a “Female” notation by hitting “s” then “f”.

The final tab allows you to vet the data’s quality. Look through the checklist they provide and select “no” for any missing qualifications. This helps ensure that observations remain accurate.

Once you’re satisfied with your additions, you can get to the next observation by either clicking the arrow to the observation’s right side or hitting the right-facing arrow on your keyboard. No back buttons required! If you’re looking for a visual explanation of how Identify works, then check out this great video from iNaturalist’s help section.

TTT Task of the Week

Now that you’ve explored Identify, it’s time to put it to use! If there is a particular place or group of species that you usually identify, then try out Identify while continuing your normal identification routine. If you’re not comfortable adding new species identifications, try focusing instead on adding annotations. Go to your filters and set them up to find species without annotations. If you’re new to this feature, look for plants and animals with clear annotations, such as species of butterflies or flowering plants. By taking the time to add identifications and evaluate data quality, you will both be helping other users become better naturalists and ensuring that observations provide a reliable data source to those using them.

Thank you for helping us map Vermont’s biodiversity and happy observing!

Publicado el enero 21, 2020 08:30 TARDE por emilyanderson2 emilyanderson2 | 2 comentarios | Deja un comentario

28 de enero de 2020

Tech Tip Tuesday: Computer Vision

Welcome back to another installment of Tech Tip Tuesday everyone! I’ve really appreciated your feedback and conversations in the comments section every week. It’s helpful to know what works and what doesn’t, and exciting to see the information that gets shared.

Some of you tuned in and offered your favorite identification resources two weeks ago. For those of you who missed that epic discussion and want some new guides to check out, you can find all of the resources discussed (plus some extras) on the Vermont Atlas of Life Identification Resource Guide. Although TTT has moved on to other topics, I highly encourage you to keep suggesting additional beloved resources.

Sorry, no anecdotes about the weather this morning. I’m still recovering from the disappointment of a very slushy cross-country skiing adventure this past weekend. However, if this warm weather keeps up, we may begin to see spring species out much earlier than usual, who knows. Keep a lookout for any sightings of seasonally out of place plants and critters, and be sure to add them to iNaturalist!

This Week on Tech Tip Tuesday

When I first started using iNaturalist, I loved that it helped me identify observations the moment that I began to upload. In fact, I still love this feature – even if I can’t always receive a species-level identification, I enjoy the instantaneous feedback about my observation. I’m sure that I’m not alone. However, like me, you may be wondering how iNaturalist accomplishes this? That’s what I’m here to talk about today.

It all begins with artificial intelligence (AI). For a lot of people, the phrase “AI” may conjure up images of human-like robots (Ash and Bishop from the “Alien” movies usually come to mind for me). While this interpretation isn’t wrong, it does only represent a very specialized (and futuristic) subset of AI’s potential. In general, AI refers to any machine operating in ways that mimic human intelligence. Many of us probably aren’t even aware of all the ways we interact with AI on a regular basis. One example is the suggestions provided by Amazon and Netflix on what to buy or watch next based on your previous interactions with the site. In this case, a machine has learned how to make complex decisions about what to recommend.

For iNaturalist, the AI is programmed to identify distinct species and groups of organisms through a process called Computer Vision. In order for it to learn through Computer Vision, large numbers of labeled images are fed through a model that learns to associate features with that label. These images are previously uploaded iNaturalist observations and the label is the research grade identification associated with the image. The model can then be used to assign labels to unlabeled pictures with the same characteristics.

Not every species has gone through this process. In order for Computer Vision to develop a model for a species, the species needs to meet a set minimum number of research grade images – twenty to be exact. The observations fed into the model also need to come from twenty or more different users. This is done to protect the model against possible errors or biases associated with individual users. Based on these criteria, about 10,000 species were eligible when Computer Vision was originally implemented. The last reported numbers indicate that 85% of all documented species are labeled and that new species cross the twenty distinct observations threshold every 1.7 hours.

So, how does this come to play in your daily life as an iNaturalist user? When you go to identify your observations, iNaturalist provides a list of possible species and genera that your observation could belong to. These suggestions are based on a list of possibilities that the model weights depending on how consistently the observation matches with the model. Computer Vision provides this weighted list instead of a definitive identification because technology is not always perfect and therefore it allows room for human judgement as well (one time iNaturalist suggested that my White-headed Woodpecker was a Giant Panda…). In instances where your observation may fall under that 15% of species lacking a model, the program will provide a coarser filter, such as genus or family, allowing human users to establish the species-level identification.

Ultimately, the program is always learning. Any new research grade observation that gets added is run through the model, helping the program improve its identification abilities. That’s one reason why it’s very important to make sure that research grade identifications are accurate.

AI and Computer Vision are complex and fascinating areas of work that are becoming increasingly common in our daily lives. If you want to learn more, iNaturalist and The Atlantic wrote great articles explaining how iNaturalist uses Computer Vision.

TTT Task of the Week

First, I encourage you all to go and read the articles linked above. They’re not long and I don’t doubt that you will walk away from them with a better understanding of how iNaturalist works. Use this info to impress your friends! Second, look back through some of your research grade identifications and use some of the resources included in TTT #12 and the Vermont Atlas of Life website to verify that users provided the correct identifications.

Thank you for helping us map Vermont’s web of life and happy observing!

Publicado el enero 28, 2020 04:43 TARDE por emilyanderson2 emilyanderson2 | 1 comentario | Deja un comentario

Archivos